Smart MACD Crossover█ OVERVIEW
Smart MACD Crossover is an indicator designed for traders who trade based on MACD line crossovers. It significantly reduces the number of false crossover signals by adding a breakout-box confirmation mechanism. Price must close outside the box created at the moment of the MACD crossover for a signal to trigger. The script also includes optional scaled MACD lines on the price chart, candle coloring, multi-layer “fog” visualization, fully customizable entry signals, automatic Take Profit / Stop Loss levels and a real-time table.
█ CONCEPTS
Standard MACD crossovers frequently produce noise, especially in ranging markets. Smart MACD Crossover attempts to solve this issue: a horizontal box is drawn at the exact bar where the crossover occurs, and a trade signal is generated only when price actually breaks out of that box. By default, the show_only_matching filter is enabled — signals are shown only when the breakout direction matches the original MACD crossover direction (bullish box → long only, bearish box → short only).
█ FEATURES
Fully configurable classic MACD (default 12/26/9)
Optional MACD & Signal lines scaled and plotted directly on the price chart (show_macd_overlay)
Trend-based candle coloring
One-Side Histogram Fog:
- 6 layers above and 6 layers below hl2
- layer height based on average candle size × offset_mult (default 0.7)
- increasing transparency (base 80 + increment 4) for depth effect
- fully customizable colors
Breakout Boxes:
- created on every MACD crossover
- default height = high-low of the signal candle
- optional extension using average candle size × box_multiplier
- semi-transparent fill (85) with colored borders, extended right until breakout
Signals:
- Triangles or “BUY” / “SELL” labels
- show_only_matching filter (enabled by default) — only direction-consistent breakouts generate signals
- when disabled, every box breakout generates a signal according to breakout direction
- Built-in alerts: BUY and SELL
Take Profit / Stop Loss:
- TP1, TP2, TP3 and SL levels drawn automatically after each confirmed signal
- two modes: Candle Multiplier (based on average candle size) or Percentage
- all multipliers/percentages fully adjustable in “Risk Management Settings”
- real-time table in the top-right corner showing current TP/SL prices
█ HOW TO USE
Add via Pine Editor → paste code → Add to Chart.
Settings overview:
- MACD Settings: lengths and source
- Risk Management Settings: TP/SL mode, multipliers/percentages, average candle period
- MACD Overlay Lines: toggle scaled MACD lines on price chart
- Fog: enable/disable, adjust height and transparency
- Visual Settings: candle coloring
- Boxes: optional size multiplier (use_box_multiplier)
- Signals: choose Triangles or Labels, enable/disable direction filter
Signal meaning:
- Triangle below bar / “BUY” label → upward breakout from a box created after bullish MACD crossover
- Triangle above bar / “SELL” label → downward breakout from a box created after bearish MACD crossover
- Open boxes = pending breakout zones
- Fog below price = bullish pressure, fog above price = bearish pressure
█ APPLICATIONS
The indicator reduces false signals coming from plain MACD crossovers. For additional trend confirmation, the scaled MACD lines can be enabled.
Entry into a position is triggered by the BUY/SELL signal generated after the breakout. The TP1–TP3 and SL levels are drawn automatically only for convenience and as a quick reference – they are fully optional and traders can (and usually should) use their own preferred exit strategies, trailing stops, partial closes, or other money-management methods.
█ NOTES
- Due to MACD line scaling onto the price chart, classic MACD divergences cannot be identified
"macd divergence" için komut dosyalarını ara

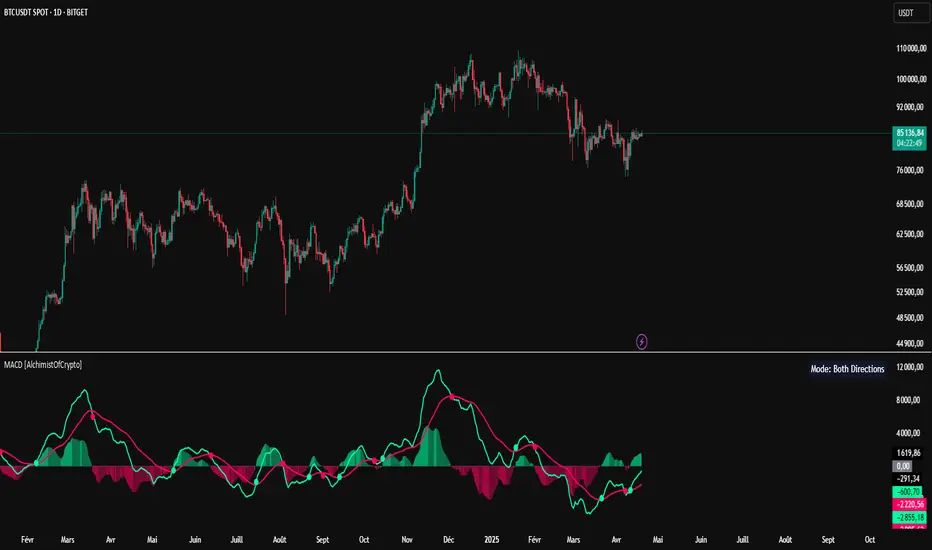
MACD [AlchimistOfCrypto]🌠 MACD Optimized with Python – Decoding the Chaos of Markets 🌠
Category: Trend Analysis 📈
"Like the dynamic systems studied in chaos theory, financial markets appear unpredictable at first glance. Yet, as Edward Lorenz demonstrated, even in apparent chaos reside harmonious mathematical structures. The MACD (Moving Average Convergence Divergence) represents this quest for order within disorder—a mathematical formulation that extracts coherent signals from price noise. By combining moving averages of different periods, this indicator reveals hidden cycles and precise moments when market energy shifts, like a pendulum obeying the immutable laws of physics."
📊 Technical Overview
The MACD Optimized with Python is a revolutionary take on the classic Moving Average Convergence Divergence indicator. Powered by Python-driven optimizations 🐍, it adapts to specific timeframes, delivering razor-sharp signals for traders seeking to navigate the market’s chaos with precision.
⚙️ How It Works
- Python-Optimized Parameters 🔧: Unlike the standard MACD (12,26,9), our version uses mathematically tailored parameters for each timeframe:
- 1H: 11/38/27
- 4H: 9/98/27
- 1D: 45/90/29
- 1W: 9/16/3
- 2W: 5/20/5
- Intuitive Visuals 🎨:
- Crossovers marked by colored dots 🟢🔴 for clear entry/exit signals.
- Histogram with a color gradient 🌈 to show direction and momentum intensity.
- Customizable Signals 🎯: Choose to display long, short, or both signals to match your trading style.
🚀 How to Use This Indicator
1. Select Your Timeframe ⏰: Choose the timeframe aligned with your trading horizon (1H, 4H, 1D, 1W, or 2W).
2. Spot Crossovers 🔍: Watch for the MACD line (green) crossing the signal line (red) to identify potential trend changes.
3. Confirm with Divergence ✅: Combine crossovers with price-MACD divergence for high-probability trend reversal signals.
📅 Release Notes
Unlock the hidden order of markets with this Python-optimized MACD. Stay tuned for future enhancements! ✨
🏷️ Tags
#Trading #TechnicalAnalysis #MACD #TrendAnalysis #Python #MultiTimeframe #Divergence #Momentum #TradingStrategy #RiskManagement #Forex #Stocks #Crypto #ChaosTheory #OptimizedTrading
Gap Reversal Signal with Indicators🔍 Gap Reversal Signal with Indicators — 結合 KD、MACD、SAR 與背離分析的多功能指標
🔍 Gap Reversal Signal with Indicators — A Multi-Tool Signal Indicator Combining KD, MACD, SAR, and Divergence Analysis
中文說明:
本指標結合多種常用技術分析工具,包括 KD 隨機指標、MACD 動能交叉、SAR 趨勢方向、以及 MACD 背離偵測,用以辨識潛在的價格反轉區域。適用於日內交易與波段操作,支援各類市場,如加密貨幣、股票與外匯等。
English Description:
This indicator combines several popular technical tools: Stochastic KD, MACD momentum crossovers, SAR trend direction, and MACD divergence detection. It helps traders identify potential reversal areas and is ideal for both intraday and swing trading. Works well on crypto, stocks, and forex markets.
🧠 功能特點 | Key Features
✅ KD指標(慢速隨機指標)檢測超買超賣並提供%K與%D交叉訊號
✅ Stochastic KD (slow) to detect overbought/oversold zones and crossover signals
✅ MACD金叉/死叉與零軸突破捕捉趨勢轉變與動能反轉
✅ MACD Crossovers + Zero-Line Breaks to capture trend changes and momentum reversals
✅ SAR指標即時顯示多空方向
✅ Parabolic SAR for real-time trend direction indication
✅ MACD背離偵測協助辨識潛在反轉區域
✅ MACD Divergence Detection for identifying hidden trend reversals
✅ 圖形提示與標籤提示可視化呈現各類訊號
✅ Visual Alerts and Labels for easy and quick signal recognition
📈 支援市場 | Supported Markets
📊 台股 / 美股 / 外匯 / 加密貨幣
📊 Taiwan Stocks / US Stocks / Forex / Cryptocurrencies (e.g. BTC, ETH)
🔧 推薦用法 | Recommended Use
搭配缺口策略與支撐壓力位使用
Use with gap-trading strategies and support/resistance zones
用於盤整末期或趨勢反轉的提示
Helpful for end-of-consolidation signals or trend reversals
支援短線與波段交易風格
Suitable for scalping and swing trading styles
💡 把這個指標加入你的圖表,立即體驗多重技術分析所帶來的交易優勢!
💡 Add this indicator to your chart now and experience the power of multi-tool technical analysis!

TDMACD Divergence Multi Timeframe and Alert [5ema]I reused some functions, made by (i believe that):
@paaax: The table position function.
@everget: The RSI divergence function.
@QuantNomad: The function calculated value and array to show on table for input symbols.
@ChaosTrader: The function calculated value TDMACD.
-----
What to do?
MACD divergence signal.
The crossing of MACD and Signal line.
The reversal of MACD.
The reversal of Signal line.
The screener follow 6 different timeframes.
Set notification alert when signal appears.
-----
How is it created?
MACD line = fastMA - slowMA.
Signal line = ta.ema(macd(), signalLength)
Make function for pivot low & high point of MACD and price.
Request.security that function for earch time frame.
-----
How to use?
Can be combined with many other indicators or candlestick patterns.
Customize the input indicators to suit your strategy
1. MACD reversed:
2. Signal line reversed:
3. MACD Divergence :
4. MACD crossing Signal line:
5. Signal on Screener for multi time frame:
Green ⦿: Buy.
Red ⦿: Sell.
Green 〇: Review Buy.
Red 〇: Review Sell.
-----
This indicator is for reference only, you need your own method and strategy.
If you have any questions, please let me know in the comments.

Institutional Quantum Momentum Impulse [BullByte]## Overview
The Institutional Quantum Momentum Impulse (IQMI) is a sophisticated momentum oscillator designed to detect institutional-level trend strength, volatility conditions, and market regime shifts. It combines multiple advanced technical concepts, including:
- Quantum Momentum Engine (Hilbert Transform + MACD Divergence + Stochastic Energy)
- Fractal Volatility Scoring (GARCH + Keltner-based volatility)
- Dynamic Adaptive Bands (Self-adjusting thresholds based on efficiency)
- Market Phase Detection (Volume + Momentum alignment)
- Liquidity & Cumulative Delta Analysis
The indicator provides a Z-score normalized momentum reading, making it ideal for mean-reversion and trend-following strategies.
---
## Key Features
### 1. Quantum Momentum Core
- Combines Hilbert Transform, MACD divergence, and Stochastic Energy into a single composite momentum score.
- Normalized using a Z-score for statistical significance.
- Smoothed with EMA/WMA/HMA for cleaner signals.
### 2. Dynamic Adaptive Bands
- Upper/Lower bands adjust based on volatility and efficiency ratio .
- Acts as overbought/oversold zones when momentum reaches extremes.
### 3. Market Phase Detection
- Identifies bullish , bearish , or neutral phases using:
- Volume-Weighted MA alignment
- Fractal momentum extremes
### 4. Volatility & Liquidity Filters
- Fractal Volatility Score (0-100 scale) shows market instability.
- Liquidity Check ensures trades are taken in favorable spread conditions.
### 5. Dashboard & Visuals
- Real-time dashboard with key metrics:
- Momentum strength, volatility, efficiency, cumulative delta, and market regime.
- Gradient coloring for intuitive momentum visualization .
---
## Best Trade Setups
### 1. Trend-Following Entries
- Signal :
- QM crosses above zero + Market Phase = Bullish + ADX > 25
- Cumulative Delta rising (buying pressure)
- Confirmation :
- Efficiency > 0.5 (strong momentum quality)
- Liquidity = High (tight spreads)
### 2. Mean-Reversion Entries
- Signal :
- QM touches upper band + Volatility expanding
- Market Regime = Ranging (ADX < 25)
- Confirmation :
- Efficiency < 0.3 (weak momentum follow-through)
- Cumulative Delta divergence (price high but delta declining)
### 3. Breakout Confirmation
- Signal :
- QM holds above zero after a pullback
- Market Phase shifts to Bullish/Bearish
- Confirmation :
- Volatility rising (expansion phase)
- Liquidity remains high
---
## Recommended Timeframes
- Intraday (5M - 1H): Works well for scalping & swing trades.
- Swing Trading (4H - Daily): Best for trend-following setups.
- Position Trading (Weekly+): Useful for macro trend confirmation.
---
## Input Customization
- Resonance Factor (1.0 - 3.618 ): Adjusts MACD divergence sensitivity.
- Entropy Filter (0.382/0.50/0.618) : Controls stochastic damping.
- Smoothing Type (EMA/WMA/HMA) : Changes momentum responsiveness.
- Normalization Period : Adjusts Z-score lookback.
---
The IQMI is a professional-grade momentum indicator that combines institutional-level concepts into a single, easy-to-read oscillator. It works across all markets (stocks, forex, crypto) and is ideal for traders who want:
✅ Early trend detection
✅ Volatility-adjusted signals
✅ Institutional liquidity insights
✅ Clear dashboard for quick analysis
Try it on TradingView and enhance your trading edge! 🚀
Happy Trading!
- BullByte

MACD histogram divergence by Rexio v1Hi everyone!
I wrote this indicator for intraday trading and it cannot be use only by itself you need to at least draw some S/R lines to make it useful. It is based at MACD histogram and gives signal when it sees divergence on MACD's Histogram when macd's histogram switchs trend. Im using it to playing with a trend most of the time looking. It highlights candles which can give good singnals to play with a trend (its based on ema200 and RSI overbought and oversold zones).
Im not a computer programist nor professional trader so it is only for educational purposes only.
CloudScore by ExitAnt📘 CloudScore by ExitAnt
CloudScore by ExitAnt 는 일목균형표(Ichimoku Cloud)의 구름대 돌파 신호를 기반으로,
다양한 추세 보조지표를 결합하여 매수 추세 강도를 점수화(0~5점) 해주는 트렌드 분석 지표입니다.
기존 일목구름 단독 신호는 변동성이 크거나 신뢰도가 낮을 수 있기 때문에,
이 지표는 여러 기술적 요소를 종합적으로 평가하여
“지금이 얼마나 강력한 추세 전환 구간인가?” 를 직관적으로 보여줍니다.
🎯 지표 목적
일목균형표 구름 돌파의 신뢰도 강화
보조지표 신호를 자동으로 점수화하여 한눈에 판단 가능
캔들 위에 이모지를 배치해 시각적으로 즉시 해석 가능
초보자부터 숙련자까지 모두 활용 가능한 추세 진입 필터링 도구
🧠 점수 계산 방식 (0~5점)
구름 상향 돌파가 발생하면 아래 조건들을 체크하여 점수를 부여합니다.
▶ +1점 조건 항목
1. 골든 크로스 발생
* 최근 설정한 n봉 이내에서 Fast MA가 Slow MA를 상향 돌파한 경우
2. RSI 과매도 구간
* RSI가 설정 값 이하일 때 추세 전환 가능성이 증가
3. MACD 강세 전환
* MACD가 0 아래에 있으면서 시그널선 상향 돌파 발생
4. RSI 상승 다이버전스
* 가격은 낮아지지만 RSI는 상승 → 바닥 신호
5. 200MA 위에 위치
* 장기 추세와 일치하는 시점만 점수 강화
▶ 점수별 이모지
1점 🟡 : 약한 진입 신호
2점 🟢 : 관찰이 필요한 강화 신호
3점 📈 : 추세 전환 가능성 증가
4점 🚀 : 강한 추세 신호
5점 👑 : 매우 강력한 진입 시그널
🖥 차트 표시 요소
구름대(Span A / Span B)만 표시하여 더 깔끔한 시각화
이모지는 캔들 위에 자동 배치
필요 시 최근 n개의 캔들만 표시하도록 설정 가능
오른쪽 상단에 조건 요약 안내창 표시
🔧 사용자 설정
Tenkan / Kijun / SenkouB 기간 조정
MA, RSI, MACD, 다이버전스 사용 여부 선택
최근 몇 개의 캔들까지 점수를 표시할지 설정 가능
이모지는 사용자 취향에 따라 변경 가능
⚠️ 유의사항
본 지표는 **가격 움직임의 확률적 해석을 돕는 보조지표**이며, 단독으로 매수·매도 결정을 내려서는 안 됩니다.
시장 상황(변동성, 거래량, 프레임)에 따라 신호의 신뢰도는 달라질 수 있습니다.
실제 매매 전략에 적용하기 전 반드시 백테스트와 검증이 필요합니다.
# **📘 CloudScore by ExitAnt — English Description**
📘 CloudScore by ExitAnt
CloudScore by ExitAnt is a trend analysis indicator that evaluates bullish trend strength by scoring (0–5 points) signals based on Ichimoku Cloud breakouts combined with multiple momentum and trend indicators.
Since the default Ichimoku Cloud breakout alone can be unreliable or highly volatile, this indicator integrates several technical conditions to visually and intuitively show
“How strong is the current trend reversal opportunity?”
🎯 Purpose of the Indicator
Enhance the reliability of Ichimoku Cloud breakout signals
Automatically score multiple signals for quick visual judgment
Place emojis directly above candles for instant interpretation
Works for both beginners and experienced traders as a trend-entry filtering tool
🧠 Scoring Logic (0–5 points)
When a bullish breakout above the cloud occurs, the indicator checks the following conditions and assigns points.
▶ +1 Point Conditions
1. Golden Cross
* Fast MA crosses above Slow MA within the user-defined lookback window
2. RSI Oversold
* RSI below threshold increases the probability of trend reversal
3. MACD Bullish Shift
* MACD is below zero while crossing above the signal line
4. RSI Bullish Divergence
* Price makes a lower low while RSI makes a higher low → potential bottom signal
5. Above the 200MA
* Only scores when price aligns with long-term trend direction
▶ Emoji by Score
1 Point 🟡 : Weak early signal
2 Points 🟢 : Improved setup; watch closely
3 Points 📈 : Decent trend reversal possibility
4 Points 🚀 : Strong trend entry signal
5 Points 👑 : Very strong bullish signal
🖥 Chart Elements
Displays only Span A / Span B to keep the cloud visually clean
Emojis automatically appear above candles
Optionally limit the number of candles displaying signals
Summary box appears in the upper-right corner
🔧 User Settings
Adjustable Tenkan / Kijun / Senkou B periods
Enable/disable MA, RSI, MACD, divergence filters
Set how many recent candles should show the score
Emojis can be customized by the user
⚠️ Disclaimer
This is a technical assistant tool that helps interpret price movement probabilities; it should not be used as a standalone buy/sell signal.
Signal reliability may vary depending on volatility, volume, and timeframe.
Always conduct backtesting and validation before using it in real trading strategies.

Pivot Reversal Signals - Multi ConfirmationPivot Reversal Signals - Multi-Confirmation System
Overview
A comprehensive reversal detection indicator designed for daytraders that combines six independent technical signals to identify high-probability pivot points. The indicator uses a scoring system to classify signal strength as Weak, Medium, or Strong based on the number of confirmations present.
How It Works
The indicator monitors six key reversal signals simultaneously:
1. RSI Divergence - Detects when price makes new highs/lows but RSI shows weakening momentum
2. MACD Divergence - Identifies divergence between price action and MACD histogram
3. Key Level Touch - Confirms price is at significant support/resistance (previous day high/low, premarket high/low, VWAP, 50 SMA)
4. Reversal Candlestick Patterns - Recognizes bullish/bearish engulfing, hammers, and shooting stars
5. Moving Average Confluence - Validates bounces/rejections at stacked moving averages (9/20/50)
6. Volume Spike - Confirms increased participation (default: 1.5x average volume)
Signal Strength Classification
• Weak (3/6 confirmations) - Small circles for situational awareness only
• Medium (4/6 confirmations) - Regular triangles, viable entry signals
• Strong (5-6/6 confirmations) - Large triangles with background highlight, highest probability setups
Visual Features
• Entry Signals: Green triangles (up) for long entries, red triangles (down) for short entries
• Exit Warnings: Orange X markers when opposing signals appear
• Signal Labels: Show confirmation score (e.g., "5/6") and strength level
• Key Levels Displayed:
o Previous Day High/Low - Solid green/red lines (uses actual daily data)
o Premarket High/Low - Blue/orange circles (4:00 AM - 9:30 AM EST)
o VWAP - Purple line
o Moving Averages - 9 EMA (blue), 20 EMA (orange), 50 SMA (red)
• Background Tinting: Subtle color on strongest reversal zones
Key Level Detection
The indicator uses request.security() to accurately fetch previous day's high/low from daily timeframe data, ensuring precise level placement. Premarket high/low levels are dynamically tracked during premarket sessions (4:00 AM - 9:30 AM EST) and plotted throughout the trading day, providing critical support/resistance zones that often influence price action during regular hours.
Customizable Parameters
• Signal strength thresholds (adjust required confirmations)
• RSI settings (length, overbought/oversold levels)
• MACD parameters (fast/slow/signal lengths)
• Moving average periods
• Volume spike multiplier
• Toggle individual display elements (levels, MAs, labels)
Best Practices
• Use on 5-minute charts for entries, confirm on 15-minute for direction
• Focus on Medium and Strong signals; Weak signals provide context only
• Strong signals (5-6 confirmations) have the highest win rate
• Pay special attention to reversals at premarket high/low - these levels frequently hold
• Previous day high/low often acts as major support/resistance
• Always use proper risk management and stop losses
• Works best in moderately trending markets
Alert Capabilities
Set custom alerts for:
• Strong long/short signals
• All entry signals (medium + strong)
• Exit warnings for open positions
Ideal For
• Daytraders and scalpers (especially SPY, QQQ, and liquid equities)
• Swing traders seeking precise entries
• Traders who prefer confirmation-based systems
• Anyone looking to reduce false signals with multi-factor validation
• Traders who utilize premarket levels in their strategy
Technical Notes
• Uses Pine Script v6
• Premarket hours: 4:00 AM - 9:30 AM EST
• Previous day levels pulled from daily timeframe for accuracy
• Maximum 500 labels to maintain chart performance
• All key levels update dynamically in real-time
________________________________________
Note: This indicator provides signal analysis only and should be used as part of a complete trading strategy. Past performance does not guarantee future results. Always practice proper risk management.

Willams %R extreme and MACD DivergenceThis is two different indicators combine into one.
First is the two different period of Williams% 5 mins and 15 mins.
Second is the MACD line of 5 mins chart.
Both will be primarily use on the 5 mins chart, you can use on another time frame if you wish
Williams %:
green = uptrending
red = downtrending
Bright green: overbought condition, look to Short at the end of the signal
Bright Red: oversold condition, look to Long at the end of the signal
MACD:
I also added the MACD line which you can use for divergence
when price move higher and MACD is moving down, expecting price to drop sometime soon or vice versa. See chart for example.

HMA 34 Dual-Fractal Projections - VdubusVdubus MacD Divergence Trend Break Signal Generator :Here:-
HMA 18 Dual-Fractal Projections
Overview
The HMA 18 Dual-Fractal Projections is a technical analysis tool designed to identify market structure and potential breakout patterns by analyzing the pivots of a Hull Moving Average (HMA).
Unlike standard trendline indicators that struggle to balance "big picture" trends with immediate price action, this indicator utilizes a Dual-Fractal approach. It simultaneously calculates two separate timelines—Macro and Micro—to visualize both the dominant channel and the developing chart patterns (such as wedges or triangles) in real-time.
Visual Guide
The indicator plots three key elements on the main chart:
The HMA Line (Blue): A smooth, fast-acting moving average (default length 34) that serves as the baseline for all calculations.
Macro Structure (Solid, Thick Lines):
Red (Solid): Major Resistance.
Green (Solid): Major Support.
Purpose: Identifies the long-term trend channel. These lines react slowly and filter out noise.
Micro Structure (Dashed, Thin Lines):
Red (Dashed): Immediate Resistance.
Green (Dashed): Immediate Support.
Purpose: Identifies the short-term market structure. These lines react quickly to show forming wedges, triangles, or flags.
How It Works
The indicator applies a "Pivot High/Low" algorithm directly to the HMA data rather than raw price data. This filters out candle wicks and volatility, ensuring lines are drawn based on established momentum shifts.
Layer 1 (Macro): Uses a large "Lookback" period (default 44 bars) to find significant peaks and valleys. It connects the most recent major pivot to the previous one, projecting a line forward to show where the major trend channel lies.
Layer 2 (Micro): Uses a small "Lookback" period (default 10 bars) to find local peaks and valleys. This allows you to see how price is behaving within the larger channel.
Settings & Configuration
HMA Settings
HMA Length: The length of the Hull Moving Average.
Default: 34 (Matches the "visually pleasing" setting from recent testing).
Note: Set to 18 for a faster, more reactive baseline (scalping).
Layer 1: Macro (Big Channel)
Macro Lookback: Determines how many bars must pass before a peak is confirmed.
Default: 44. High values find broad, established channels.
Max Macro Lines: How many historical lines to keep on the chart.
Default: 1 (Keeps the chart clean, showing only the current structure).
Extend Macro Lines: Projects the lines infinitely to the right to predict future support/resistance zones.
Layer 2: Micro (Current Pattern)
Micro Lookback: A lower sensitivity setting to catch immediate structure.
Default: 10. Low values will pinpoint the exact boundaries of small wedges or flags forming right now.
Trading Strategy & Interpretation
1. The "Squeeze" (Wedge Identification) This is the primary use case.
Look for scenarios where the Macro Lines (Solid) are wide/parallel, but the Micro Lines (Dashed) are rapidly converging (pointing towards each other).
This indicates that while the main trend is intact, momentum is compressing. A breakout is imminent where the dashed lines intersect.
2. Trend Channels
When both Solid and Dashed lines are roughly parallel and sloping in the same direction, the trend is healthy and strong. Price is respecting both the short-term and long-term momentum.
3. Divergence / Early Reversal Warning
If the Macro Line is sloping UP, but the Micro Line starts sloping DOWN (crossing inside), it indicates a loss of momentum and a potential reversal before the price actually breaks the major trendline.
===========================================================================
2. Micro/Macro Cross Alert
A new input, Enable Micro/Macro Cross Alert, has been added under the "Alerts & Features" section.
This alert condition is triggered when the momentum of the Micro Structure exceeds the momentum of the Macro Structure, which is a high-probability signal for a breakout:
Bullish Alert: The Micro High (dashed red line) crosses above the Macro High (solid red line).
Bearish Alert: The Micro Low (dashed green line) crosses below the Macro Low (solid green line).
To set up the actual alert on your chart:
Right-click on the chart.
Select "Add alert on HMA 34 Dual-Fractal Projections".
In the Condition dropdown, select the indicator's name.
For the main alert criteria, choose "Any alert()".
Select your preferred alert actions (e.g., notification, email).

Trend Confirmation StrategyComprehensive Trend Confirmation System
Indicator Features (Professional Description):
Comprehensive Trend Confirmation System is a versatile indicator meticulously designed to identify and confirm trend-based trading opportunities with exceptional efficiency. By seamlessly integrating analysis from a suite of leading technical tools, it aims to provide superior accuracy and reliability for informed trading decisions.
Key Features:
Intelligent Trend Identification: A robust trend analysis system that considers:
Adjustable Moving Averages: Utilizes three customizable moving average periods (fast, medium, slow) with user-selectable lengths and types (SMA, EMA, WMA, VWMA) to accurately determine the prevailing trend across different timeframes.
In-depth Price Action Analysis: Examines the formation of Higher Highs/Higher Lows (uptrend) and Lower Highs/Lower Lows (downtrend) to validate price direction.
Average Directional Index (ADX) with Adjustable Threshold: Measures the strength of a trend and employs the comparison between +DI and -DI to pinpoint the dominant momentum, featuring a customizable threshold to filter out weak signals.
Multi-Factor Signal Confirmation System: Enhances the reliability of trading signals through verification from four distinct confirmation tools:
Volume Analysis with Average Reference: Assesses whether trading volume supports price movements by comparing it to historical averages.
Relative Strength Index (RSI) with Reference Levels: Measures price momentum and identifies overbought/oversold conditions to confirm trend strength.
Moving Average Convergence Divergence (MACD) Divergence and Crossovers: Detects shifts in momentum and potential trend changes through the relationship between the MACD line and the Signal line.
Stochastic Oscillator with Reference Levels: Measures the current price's position relative to its historical range to evaluate overbought/oversold conditions and potential reversal opportunities.
Intelligent Signal Generation Logic:
Buy Signal: Triggered when a strong uptrend is identified (meeting defined criteria) and confirmed by at least three out of the four confirmation tools.
Sell Signal: Triggered when a strong downtrend is identified (meeting defined criteria) and confirmed by at least three out of the four confirmation tools.
User-Friendly Visualizations:
Moving Averages (MA): Displays three MA lines on the chart with user-configurable colors (default: fast-blue, medium-orange, slow-red) for easy visual trend analysis.
Clear Buy and Sell Signal Symbols: Presents distinct green upward-pointing triangles for buy signals and red downward-pointing triangles for sell signals at the corresponding candlestick.
Dynamic Candlestick Color Coding: Candlesticks are dynamically colored green upon a buy signal and red upon a sell signal for quick identification of trading opportunities.
Highly Customizable Parameters: Users have extensive control over the indicator's parameters, including:
Lengths and types of Moving Averages.
Length and Threshold of the ADX.
Length of the RSI.
Parameters for the MACD (Fast Length, Slow Length, Signal Length).
Parameters for the Stochastic Oscillator (%K Length, %D Length, Smoothing).
Ideal For:
Traders seeking a robust tool to accurately identify and confirm market trends.
Individuals aiming to reduce false signals and enhance the precision of their trading decisions.
Traders employing trend-following strategies in markets with clear directional movement.
Important Note:
While Comprehensive Trend Confirmation System is engineered to improve trading accuracy, no indicator can guarantee 100% profitable trades. Users are advised to utilize this indicator in conjunction with relevant fundamental analysis and sound risk management practices for optimal trading outcomes.

[blackcat] L3 Composite Trading System with ControlOVERVIEW
This indicator combines three distinct trading strategies into a unified decision-making framework. Utilizing KDJ oscillators, MACD divergence analysis, and adaptive signal filtering techniques, it provides actionable buy/sell signals validated against multi-period momentum trends and structural support/resistance levels.
FEATURES
Integrated KDJ oscillator with weighted moving average smoothing
Dynamic MACD difference visualization normalized against price volatility
Multi-layered confirmation process: • Momentum convergence/divergence tracking
• Candle pattern recognition (Yellow/Fuchsia flags)
• SMAs cross-validation (20/60-day thresholds)
Adaptive risk controls via tunable α parameter adjustment
HOW TO USE
Set Alpha Period parameter matching market cycle characteristics
Monitor primary trend direction via candle coloring (green/red zones)
Confirm directional bias using: ▪️ KDJ-J line position relative to zero axis ▪️ MACD histogram slope persistence (>3 bar validation)
Execute trades only when: • Buy/Sell labels align across both oscillator panels • Coincide with candle flag transitions (e.g., red→yellow) • Validate against concurrent SMA breakout conditions
LIMITATIONS
Lag inherent in EMA-based components during rapid reversals
Requires minimum 60-bar history for full functionality
Sensitive to fractal scaling due to normalization methods
Does not account for liquidity/volume dynamics
NOTES
• Yellow/Fuchsia flags reflect relative strength changes vs prior session
• SMA crossover validations have 16-bar lookback memory retention

Tango Multi-Timeframe Trend DotsTLDR: When the background is green, favor long. When the background is red, favor short.
By default: Will show 5-minute, 10-minute, 15-minute timeframe.
📈 Tango Multi-Timeframe Trend Dots
Tango Trend Dots is a visual trend-tracking tool that plots clean, color-coded trend signals from up to three different timeframes in a dedicated indicator pane. Each dot represents the trend direction on that timeframe:
🟢 Green = Uptrend
🔴 Red = Downtrend
🟡 Yellow = Trend-MACD conflict (optional MACD filter)
🔧 Features
Multi-Timeframe Support: Configure 3 different timeframes (default: 5m, 10m, 15m)
Color-Coded Trends:
Green = uptrend
Red = downtrend
Yellow = conflicting trend & MACD (if enabled)
MACD Filter (optional): Highlights trend conflicts using MACD histogram
Background Shading: Optional highlight when 2 out of 3 timeframes agree
Customizable UI: Clean labels and visual alignment of all signals
📊 Use Cases
Confirm short-term trades with higher timeframe alignment
Identify conflicting signals using MACD divergence
Spot consensus trends with visual clarity

Volume Cross ━ (For Volume Crop) [whvntr]This fulfills a request from user: iTibu to make an oscillator to go along with one of my indicators named: " Volume Crop ━ Hidden Volume Divergence ". It essentially does the same thing, without the Midline Tool , so you can better understand where the crosses are happening. Again, the hidden MACD Divergence circles formula originated from TheLark. I converted these values to volume instead of price.
Disclaimer: using this indicator, or any indicator anywhere, involves risk when trading and isn't a guarantee of 100% accurate results.

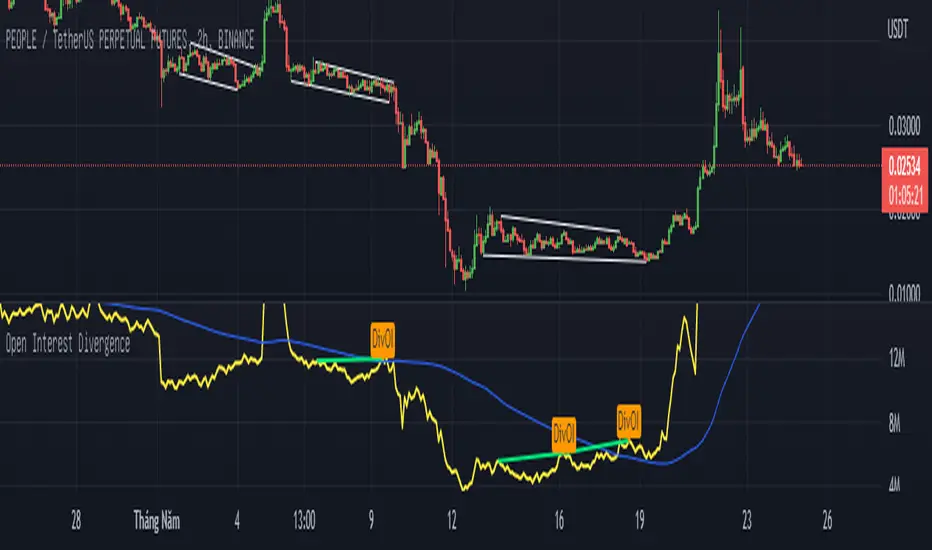
Open Interest Divergence (OI vs Price)This indicator show having increasing Open Interest but price still move in a range (Open Interest Divergence vs price).
It is same with Divergence of indicators as RSI Divergence, Macd Divergence, .... It is easy to understand.
Additional, with MA line OI, you can see the change of OI.
Liquidity Strain Detector [MarkitTick]💡 This indicator provides a specialized method for detecting market anomalies where price movement becomes disconnected from typical volume profiles, signaling potential exhaustion events. By combining statistical analysis of liquidity (price impact) with a directional trend filter, the tool aims to highlight moments of extreme market stress, such as panic selling or euphoric buying, that often precede mean reversions or trend pauses.
● Originality and Utility
Standard volume indicators often look at raw volume levels, which can be misleading during different times of the day or across different assets. This script calculates the efficiency of moving price (Illiquidity) and normalizes it statistically. This allows the trader to see when the market is becoming thin or stressed relative to recent history. It is particularly useful for contrarian traders looking for capitulation points within established trends, offering a unique perspective beyond standard RSI or MACD divergence.
● Methodology
The core mechanism drives a custom Liquidity Engine that performs the following steps:
Price Impact Calculation: It computes the ratio of the True Range to Volume. High values indicate that price is moving significant distances on relatively low volume or that volatility is extreme relative to participation.
Normalization: The raw impact data is smoothed using a logarithmic scale to handle the wide variance in volume data.
Statistical Scoring (Z-Score): The script calculates the Z-Score of this normalized data over a user-defined lookback period. This determines how many standard deviations the current liquidity stress is away from the mean.
Trend Filtering: A standard Exponential Moving Average (EMA) determines the dominant market direction to contextualize the stress signal.
● How to Use
The indicator plots labels on the chart when specific High Stress conditions are met during a trend:
SE (Seller Exhaustion - Green Label): Appears when the market is in a downtrend (price below EMA), the current candle is bearish, and the liquidity stress Z-Score breaches the upper threshold. This suggests panic selling or a liquidity gap down, often marking a temporary bottom or reversal point.
BE (Buyer Exhaustion - Red Label): Appears when the market is in an uptrend (price above EMA), the current candle is bullish, and the liquidity stress Z-Score breaches the upper threshold. This suggests a melt-up or buying climax into thin liquidity, often preceding a pullback.
● Inputs
Trend Filter Length: The period for the EMA used to determine the baseline trend direction.
Statistical Lookback: The number of bars used to calculate the mean and standard deviation for the Z-Score.
Stress Threshold (Sigma): The Z-Score value required to trigger a high-stress signal. Higher values result in fewer, more extreme signals.
● Disclaimer
All provided scripts and indicators are strictly for educational exploration and must not be interpreted as financial advice or a recommendation to execute trades. I expressly disclaim all liability for any financial losses or damages that may result, directly or indirectly, from the reliance on or application of these tools. Market participation carries inherent risk where past performance never guarantees future returns, leaving all investment decisions and due diligence solely at your own discretion.

Volume CandlesVolume Candles — Context-Aware Candle Color
Description:
This visual indicator colors your price candles based on relative volume intensity, helping traders instantly detect low, medium, and high volume activity at a glance. It supports two modes — Percentile Ranking and Volume Average — offering flexible interpretation of volume pressure across all timeframes.
It uses a 3-tiered color system (bright, medium, dark) with customizable tones for both bullish and bearish candles.
How It Works:
You can choose between two modes for volume classification:
Ranking Mode (Default):
Measures current volume’s percentile rank over a lookback period. Higher percentiles = stronger color intensity.
Percentile thresholds:
< 50% → light color (low volume)
50–80% → medium intensity
> 80% → high volume
Volume Average Mode:
Compares current volume against its simple moving average (SMA).
Volume thresholds:
< 0.5× SMA → light color
Between 0.5× and 1.5× → medium
> 1.5× → high intensity
Candle Paint:
Candles are colored directly on the chart, not in a separate pane. Bullish candles use green shades, bearish use red. All colors are fully customizable.
How to Interpret:
Bright Colors = High volume (potential strength or climax)
Muted/Transparent Colors = Low or average volume (consolidation, traps)
Example Use Cases:
Spot fakeouts with large price movement on weak volume (dark color)
Confirm breakout strength with bright candles
Identify stealth accumulation/distribution
Inputs & Settings:
Mode: Ranking Percentile or Volume Average
Lookback Period for ranking and SMA
Custom Colors for bullish and bearish candles at 3 intensity levels
Best For:
Price action traders wanting context behind each candle
Scalpers and intraday traders needing real-time volume feedback
Anyone using volume as a filter for entries or breakouts
Pro Tips:
Combine with Price Action, Bollinger Bands or VWAP/EMA levels to confirm breakout validity and intent behind a move.
Use alongside RSI/MACD divergences for high-volume reversal signals.
For swing trading, expand the lookback period to better normalize volume over longer trends.

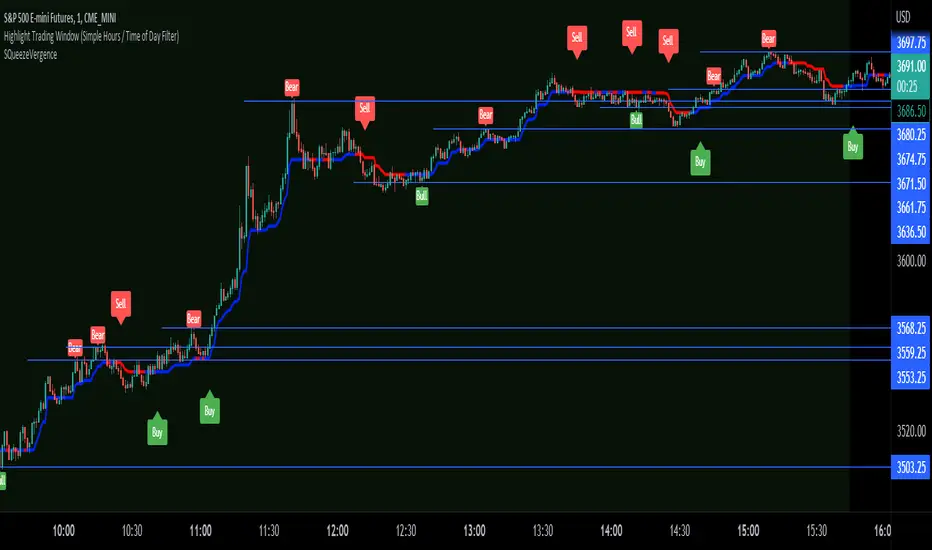
SQueezeVergenceThis is my SQueezeVergence indicator. It fires Buy and Sell signals based on squeeze momentum and trend. **It also creates Bull and Bear signals based on MACD divergence which should only be used as areas of support and resistance being as these signals repaint based on a 5 candle look back of pivots.** All settings are editable for better use. The default settings are what I use on the 1 Minute chart of ES to scalp. This is a simple indicator to help me get alerts on when I need to scalp. The divergence signals work well for areas of significance. I like to watch for breaks of these levels along with support and resistance. I hope this helps.
Crypto EMA 60/20Intended for use with Cryptocurrency Markets on the 12 hour time frame, the 60/20 exponential moving average frequency has proven successful for identifying trend bottom formations and for verifying head and shoulders top formations.
Combine the Crypto EMA 60/20 with classical RSI and MACD divergences to help verify impending reversals.
Useful for identifying trend changes in the frequency of four to six month price trends followed by a four to six week reversal, as historically found in cryptocurrency bull and bear markets.
This signal gets noisy if prices trend sideways for more than 30 days - consult daily views.
MACD+STOCHASTICA simple strategy that use MACD and STOCHASTIC to give buy/sell signal. Use fractals to put stop loss
Intelligent Top & Bottom Finder v9.8 Keyvankh📈 Intelligent Top & Bottom Finder v9.8 Keyvankh
A next-generation all-in-one trading system for precise tops, bottoms, and reversals across all timeframes.
---
🟢 Overview
This indicator is a powerful and intelligent solution for detecting market tops and bottoms, key reversals, and S/R zones with institutional-grade accuracy. Designed for traders seeking an edge in any market (crypto, forex, stocks), it combines advanced candlestick recognition, multi-indicator confirmation, smart support/resistance clustering, and strict signal filtering into one seamless tool.
---
🔎 How Does It Work?
1. Advanced Support & Resistance Clustering
Automatically detects and draws high-probability support and resistance zones using dynamic ATR-based pivot clustering.
Highlights breakouts and retest (flip) zones in real-time, adapting to changing market structure.
2. Full Candlestick Pattern Recognition
Scans for 15+ classic and advanced patterns: Engulfing, Pin Bar, Doji, Three Bar, Marubozu, Hammer, Shooting Star, Three White Soldiers, Three Black Crows, Tweezer, Morning/Evening Star, Kicker, Belt Hold, and more.
Scores each pattern’s strength based on location (S/R zone, retest, breakout), volume context, and confirmation signals.
3. Multi-Indicator Confirmation Engine**
Integrates and scores confirmation from up to five additional sources:
RSI Games 1.2** (smoothed LTF momentum shifts)
MACD Divergence** (bullish/bearish momentum reversal)
QQE+ v7 Advanced** (dynamic volatility filter)
OBV Trend Filter** (volume-backed trend validation)
Volume Game** (net volume spike and reversal detection)
Each module can be enabled or disabled to fit your personal trading style.
4. Institutional S/R and Retest Logic
Real-time recognition of major trendline breaks, retest zones, and price flips.
Automatic labeling and coloring of S/R zones, retest boxes, and confirmation candles.
5. Smart Buy & Sell Signal Generation**
Combines all scoring modules with strict logical filters and “failsafe override” logic (guaranteeing signal on confirmed hammers, engulfings, etc. even if other filters disagree).
Plots clear “BUY” and “SELL” labels only when a strong, multi-factor signal appears—minimizing noise and maximizing reliability.
Built-in fallback logic (optional) for edge cases.
6. Alerts & Automation Ready
TradingView alerts for all BUY, SELL, or ANY signal conditions—perfect for auto-trading or notification setups.
---
*⚙️ Customizable Inputs
Enable/Disable any module (RSI Games, MACD, OBV, QQE+, Candlestick Scanner, Volume Game)
Minimum Confirmations** required for a signal (1–10)
Pivot/Zone Sensitivity:** ATR multiplier, pivots per cluster, retest bar duration
LTF (Lower Timeframe) Confirmation:** Fully configurable
---
📊 How To Use**
Apply on any timeframe and symbol**—crypto, stocks, forex, indices.
Use as a **standalone reversal/entry tool** or to confirm your own technical setups.
Combine with your favorite momentum, trend, or volume indicators for advanced confluence.
Set up **TradingView alerts** for auto-trading, Telegram/email notifications, or trade journaling.
---
🟢 What Makes This Unique?
All-in-one multi-indicator fusion:** No more juggling a dozen scripts.
Institutional logic:** Goes beyond basic signals with true S/R, retest, and volume logic.
Full transparency:** Source code is clear and commented (if published open-source).
Fast and reliable:** Optimized for minimal lag and maximum accuracy.
---
⚠️ Disclaimer**
This indicator is a tool to assist with trade timing and risk management. **No system is 100% accurate.** Always use in conjunction with your own analysis and risk management practices.
---
📚 Credits & License**
Created by Keyvan Khodakhah.
You may use, modify, or share this script under the (mozilla.org).
Please credit the original author if you fork or reuse in public.
---
Questions, feedback, or collaboration? Contact: Keyvankh
---
Precision in technical analysis comes from layers of confluence and discipline. This tool brings that precision to your chart.

BTC/USD 3-Min Binary Prediction [v7.2 EN]BTC/USD 3-Minute Binary Prediction Indicator v7.2 - Complete Guide
Overview
This is an advanced technical analysis indicator designed for Bitcoin/USD binary options trading with 3-minute expiration times. The system aims for an 83% win rate by combining multiple analysis layers and pattern recognition.
How It Works
Core Prediction Logic
- Timeframe: Predicts whether BTC price will be ±$25 higher (HIGH) or lower (LOW) after 3 minutes
- Entry Signals: Generates HIGH/LOW signals when confidence exceeds threshold (default 75%)
- Verification: Automatically tracks and displays win/loss statistics in real-time
5-Layer Filter System
The indicator uses a sophisticated scoring system (0-100 points):
1. Trend Filter (25 points) - Analyzes EMA alignments and price momentum
2. Leading Indicators (25 points) - RSI and MACD divergence analysis
3. Volume Confirmation (20 points) - Detects unusual volume patterns
4. Support/Resistance (15 points) - Identifies key price levels
5. Momentum Alignment (15 points) - Measures acceleration and deceleration
Pattern Recognition
Automatically detects and visualizes:
- Double Tops/Bottoms - Reversal patterns
- Triangles - Ascending, descending, symmetrical
- Channels - Trending price channels
- Candlestick Patterns - Engulfing, hammer, hanging man
Multi-Timeframe Analysis
- Uses 1-minute and 5-minute data for confirmation
- Aligns multiple timeframes for higher probability trades
- Monitors trend consistency across timeframes
Key Features
Display Panels
1. Statistics Panel (Top Right)
- Overall win rate percentage
- Hourly performance (wins/losses)
- Daily performance
- Current system status
2. Analysis Panel (Left Side)
- Market trend analysis
- RSI status (overbought/oversold)
- Volume conditions
- Filter scores for each component
- Final HIGH/LOW/WAIT decision
Visual Signals
- Green Triangle (↑) = HIGH prediction
- Red Triangle (↓) = LOW prediction
- Yellow Background = Entry opportunity
- Blue Background = Waiting for result
Configuration Options
Basic Settings
- Range Width: Target price movement (default $50 = ±$25)
- Min Confidence: Minimum confidence to enter (default 75%)
- Max Daily Trades: Risk management limit (default 5)
Filters (Can be toggled on/off)
- Trend Filter
- Volume Confirmation
- Support/Resistance Filter
- Momentum Alignment
Display Options
- Show/hide signals, statistics, analysis
- Minimal Mode for cleaner charts
- EMA line visibility
Important Risk Warnings
Binary Options Trading Risks:
1. High Risk Product - Binary options are extremely risky and banned in many countries
2. Not Investment Advice - This tool is for educational/analytical purposes only
3. No Guaranteed Returns - Past performance doesn't predict future results
4. Capital at Risk - You can lose your entire investment in seconds
Technical Limitations:
- Requires stable internet connection
- Performance varies with market conditions
- High volatility can reduce accuracy
- Not suitable for news events or low liquidity periods
Best Practices
1. Paper Trade First - Test thoroughly on demo accounts
2. Risk Management - Never risk more than 1-2% per trade
3. Market Conditions - Works best in normal volatility conditions
4. Avoid Major Events - Don't trade during major news releases
5. Monitor Performance - Track your actual results vs displayed statistics
Setup Instructions
1. Add to TradingView chart (BTC/USD preferred)
2. Use 30-second or 1-minute chart timeframe
3. Adjust settings based on your risk tolerance
4. Monitor F-Score (should be >65 for entries)
5. Wait for clear HIGH/LOW signals with high confidence
Alert Configuration
The indicator provides three alert types:
- HIGH Signal alerts
- LOW Signal alerts
- General entry opportunity alerts
Legal Disclaimer
Binary options trading may not be legal in your jurisdiction. Many countries including the USA, Canada, and EU nations have restrictions or outright bans on binary options. Always check local regulations and consult with financial advisors before trading.
Remember: This is a technical analysis tool, not a money-printing machine. Successful trading requires discipline, risk management, and continuous learning. The displayed statistics are historical and don't guarantee future performance.
